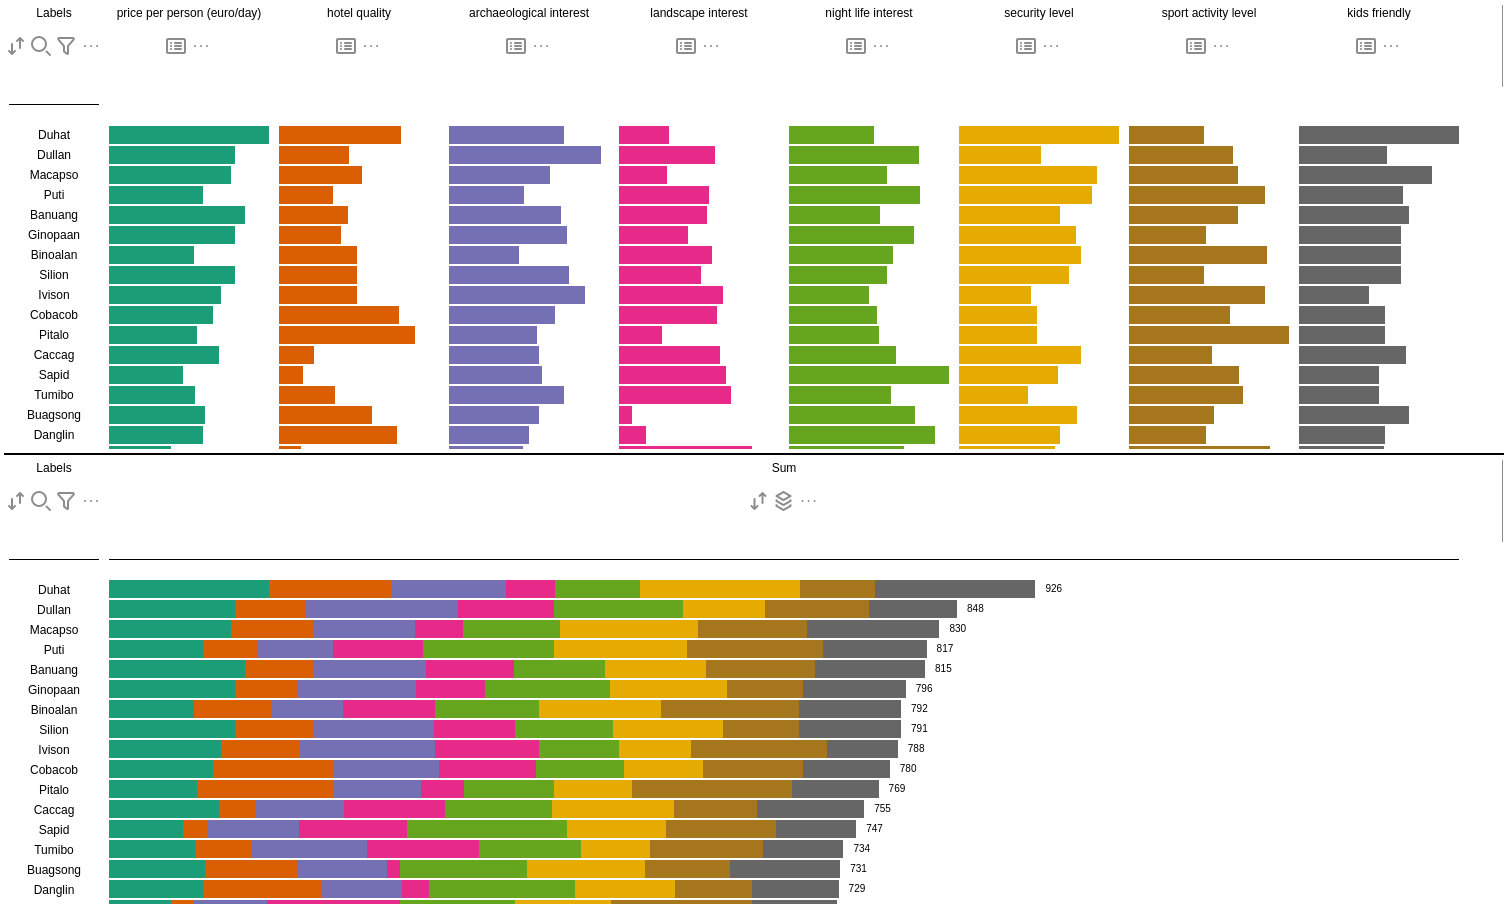
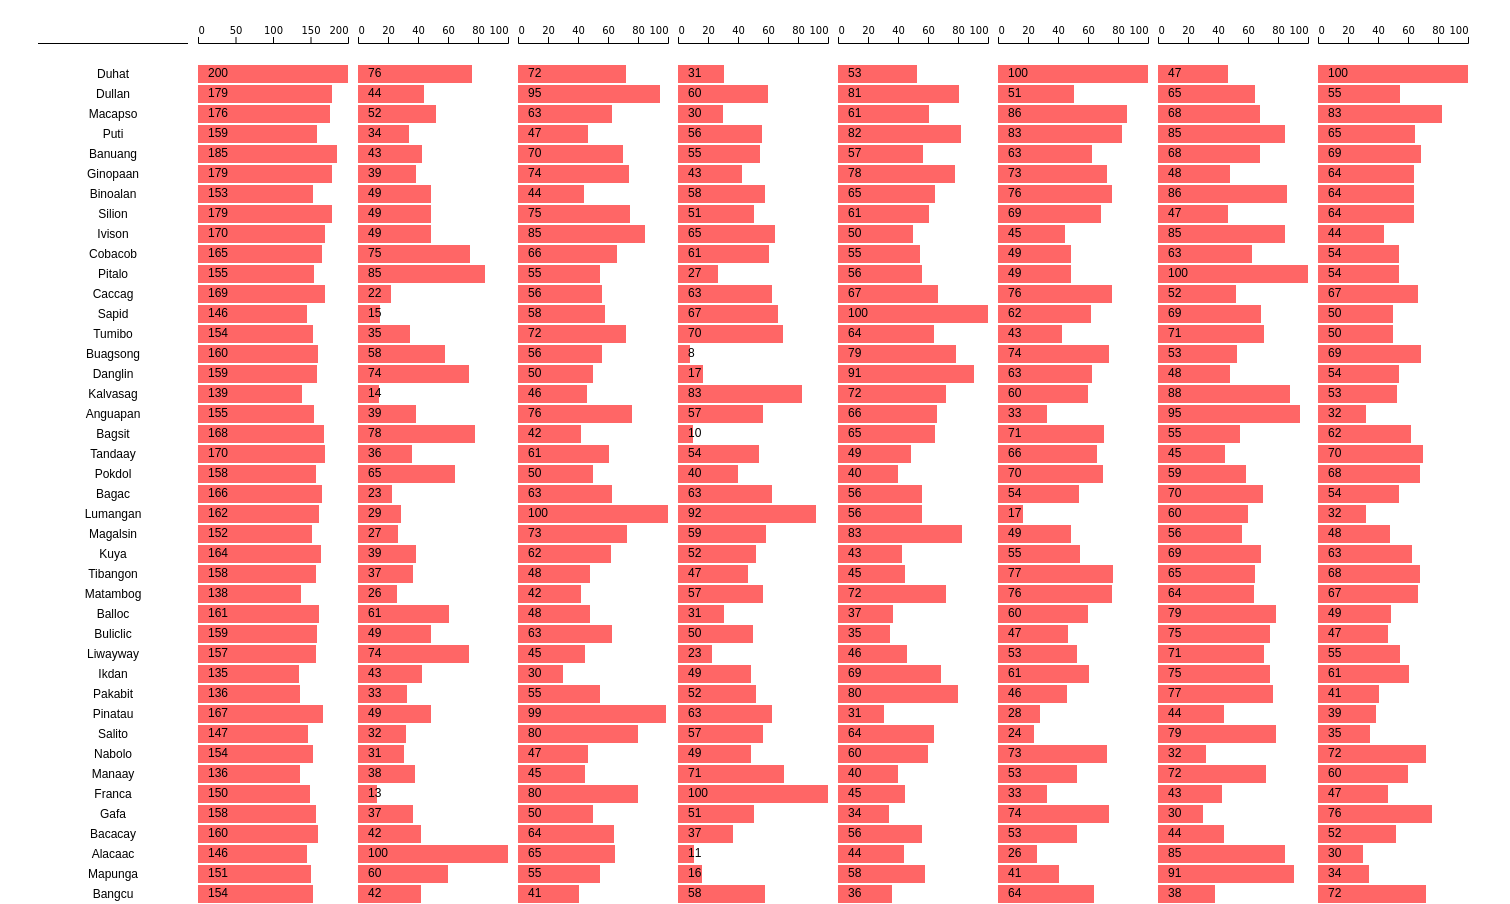
Parallel Coordinates Parallel coordinates is a common way of visualising high-dimensional geometry and analysing multivariate data. Stacked Bar Chart A stacked bar chart is a type of bar chart that is used to display and compare the parts of a whole. Scatterplot Matrix A scatterplot matrix is a grid of scatterplots that shows the relationships between pairs of variables. Tabular Visualisation A tabular visualisation is a table that displays data in rows and columns. It is useful for comparing values. ValueChart A ValueChart is a combination of both invidivual and stacked bars to compare data and the weight each attributes hold. LineUp LineUp is a visualisation used to rank and compare rows of data on many attributes.